Awara Group Study on Real GDP Growth Net-of-Debt
Awara Group Study on Real GDP Growth Net-of-Debt
29,350 viewsThis groundbreaking study by Awara reveals that the real, debt-adjusted, GDP growth of Western countries has been in negative territory for years. Only by massively loading up debt have they been able to hide the true picture and delay the onset of an inevitable collapse of their respective economies. The study shows that the real GDP of those countries hides hefty losses after netting the debt figures, which gives the Real-GDP-net-of-debt.
The moral of the study is that it is that GDP growth figures as such reveal very little about the underlying dynamics of an economy if one does not simultaneously attempt to analyze what part of the growth is credited to simply artificially fueling the economy with new loans.
The idea behind this study is to reveal real GDP growth after accounting for the effect of fueling the national economy with new public debt (general government debt). As of now, it is already a fundamentally accepted practice to adjust the GDP to the effects of inflation, the result of which is given as the ‘real GDP growth’. With this in mind, it is only natural to also apply the method presented here, of adjusting GDP growth to take into account the effect of new debt, which yields the ‘real-GDP-growth-net-of-debt’. We consider this to be a groundbreaking study, as we are not aware of economists having ever attempted this before. Neither have we heard that this problem has been discussed among scholars and analysts. Naturally, the debt problem is widely discussed, but here we refer to the idea of netting the GDP by deducting the debt effect.
The Western countries have lost the capacity to grow their economies. All they have left is a capacity to pile up debts. By massively accumulating new debt, they are able to keep up a semblance of at least sluggish growth, or of hovering around the zero growth mark.
If this massive debt would go towards investments, then there would be nothing wrong with it. But, it is not. The debt is going towards financing the losses in the national economies and essentially it all is wasted on consumption that the countries in reality cannot afford. The Western countries act like a 19th century heir to aristocratic wealth, borrowing from year to year to keep up the former lifestyle, while the estate is relentlessly dwindling. Sooner or later the prodigal heir would be forced to face reality and sell the remaining property to stave off the creditors, downgrade his dwellings, and rein in spending. Inevitably, the European countries and the USA will have to curb their excessive consumption, too, but for the time being they are putting off the final reckoning with new debt rather the way a drunkard reaches for the morning after drink to put off sobering up. In the case of the EU and the USA, we are speaking about a debt binge that has been going on for a decade.
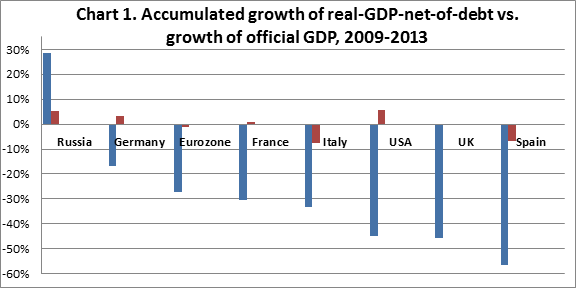
While the situation has been generally bad for the last decade or so, it took a dramatic turn for the worse, or should we say for the catastrophic, following the onset of the global financial crisis in 2008. The shocking figures depicting the virtual crippling of the Western economies from 2009 to 2013 are illustrated in Chart 1. It shows the real GDP growth net-of-debt after deducting the growth of public debt from the GDP figure. Net of debt we see the scale of destruction of the Spanish economy, which amounts to the staggering figure of minus 56.3%. This while the conventional official method of crediting GDP growth with growth of debt would give only minus 6.7%. The corresponding figures for the Eurozone in total are -27.2% for the debt adjusted GDP and -0.2% according to the official method. Even Germany’s true economic health comes out surprisingly dire in this analysis, with a GDP growth net-of-debt of -16.6% versus an official GDP growth of -0.7%. The figures of those debt-ridden Western countries are compared with that of financially prudent Russia. They show that in the same period Russia has been able to generate real GDP growth net-of-debt in the amount of 28.5% with an official GDP growth figure of 5.7%.
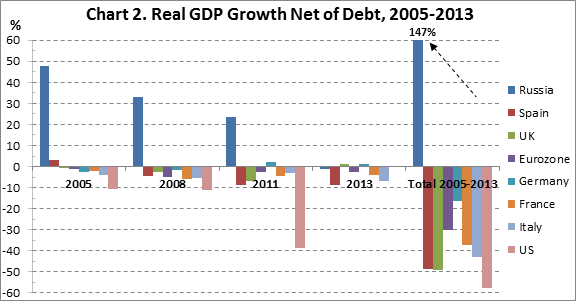
Chart 2 depicts the development of real-GDP-growth per country in years 2005 to 2013. The chart shows that during this period Russia has been able to deliver real non-debt fueled GDP growth, whereas the Western countries are running huge deficits. The accumulated growth of the Russian economy from 2005 to 2013 was 147% while the Western countries accumulated losses from 16.5% (Germany) to 58% (USA). In the case of Russia, the real-GDP-net-of-debt figure is also corrected to adjust for the calculation error caused by an erroneous GDP deflator that Russian Statistics Agency (Rosstat) has used. We have discussed the persistent problem of Russia’s GDP growth having been underestimated due to the use of a wrong GDP deflator in the study Awara Research on the Effects of Putin’s Tax Reforms 2000-2012 on State Tax Revenue and GDP:
The difference between the real debt-free GDP development of Russia, USA and Eurozone is best illustrated by Chart 3.

Chart 4 shows how much the accumulation of debt in the Western countries exceeds the official GDP growth. The USA is leading the pack with an increase in the debt load in years 2004 to 2013 of USD 9.8 trillion (in the chart in euros, EUR 7 trillion). In those years, the growth of the USA public debt exceeded the GDP growth 5 times (500%), which is illustrated by Chart 5, comparing the proportion of growth of debt to that of growth of GDP.
The comparison of growth of debt to growth of GDP reveals the UK, as the country that has amassed the most amount of new debt relative to GDP growth, having a new-debt-to-GDP-growth ratio of 9 to 1; in other words UK has taken on 900% new debt relative to the GDP growth. But the picture is grim for all the Western countries surveyed, less so for Germany, while Russia’s debt increase amounts to only a fraction of the GDP growth.


The analysis shows that by these measures Russian economic growth, unlike that of the Western countries, has been comparatively healthy and not debt-driven. Russia has in fact a resoundingly positive ratio by these measures, where GDP growth has exceeded growth of debt by a staggering 14 times (1400%). The figure is astonishing when compared with the Western countries that have been flooded with new debt.
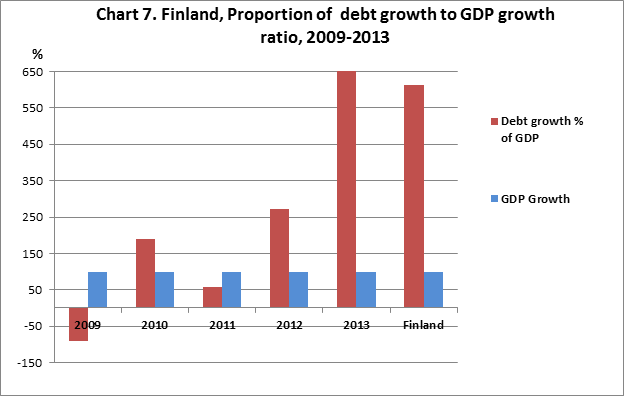
The situation looks bad also for the smaller EU countries like Finland. Even though Finland enjoys a reputation of being financially more sound than most EU countries, it is actually faring quite badly. Finland’s favorable reputation was earned in the years before 2008, but after the financial crisis that started in that year Finnish government spending has gotten totally out of hand. In the five years since the onset of the crisis, Finland has added on average 10 billion euro of debt each year or a total of some 50 billion in as many years(Chart 6). The proportion of growth of debt to growth of GDP has been 600% in the same period (Chart 7). This has yielded a dismal accumulated real-GDP-net-of-debt of -30.5% between 2009 and 2013 (Chart 8)

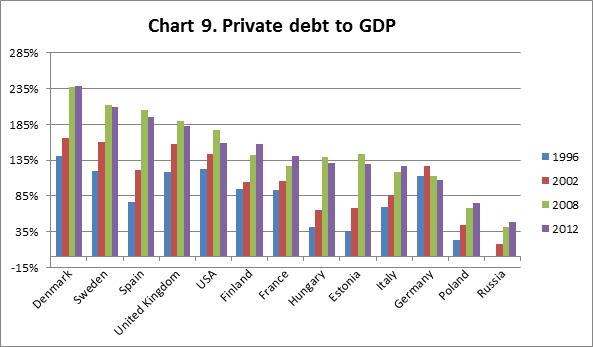
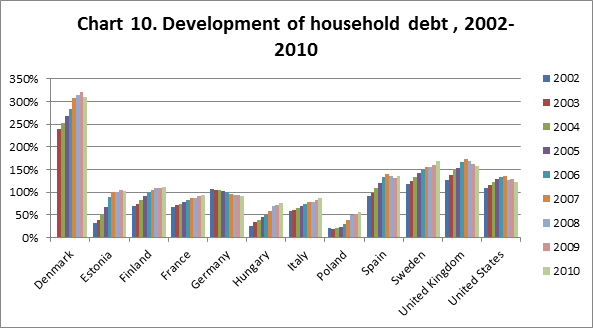
The above figures are adjusted taking into account public debt (general government debt), but the situation is even worse when we consider the effect of private debt on the GDP. New debt of corporations and households have at least doubled private debt of most of the Western countries since year 1996 (Chart 9). The dynamics of growth of household debt followed the same path but seems to have levelled of in most countries in recent years as the debt seems to have reached the limits of the possibly tenable (Chart 10).
We have not included Japan and China in the analysis due to the difficulties attributed to finding consistent data for all the input variables. For those countries we have come across problems of fractured data that do not capture all the relevant years; inconsistent data across the samples we looked at; and uncertainties about conversion of the input data into euros. (We are sure that major research houses could overcome such problems, having greater and more sophisticated resources than ours). This exclusion of Japan and China is regrettable as Japan is the country worst affected by the problem of debt-fueled GDP growth, having a public debt to GDP ratio of well above 200%, and would therefore have been very instructive for our purposes.
Japan has been essentially living on debt since the early 1990’s. However, some of the more irrational Western analysts want to take Japan as a prime example to follow, arguing that since Japan has been able to pile up debt for some 25 years now, all the Western countries would be able to do it as well for the foreseeable future. In this they fail to grasp that Japan earlier had the luxury of being the sole country living on such exorbitant levels of debt. Japan has enjoyed great support from the Western countries to be able to continue that practice, not least for political reasons. Another important consideration against the idea that Western countries could continue to accumulate debt is that they have, since the early 1990’s, rapidly lost their economic hegemony in terms of share of world trade and global GDP. I have written about this in a recent article entitled Why the West is Destined to Decline.
Reviewing these figures, it becomes evident that in reality Western economies have not grown in the past decade, rather the countries have massively inflated their debt load. With these levels of debt reached this cannot continue for long. There is a real risk that the bluff will be called sooner rather than later dropping the Western economies to GDP levels that they can carry without debt leverage. But in that situation they will not be able to serve the accumulated debts leading to catastrophe scenarios.
The West is fast shrinking in economic significance relative to the rest of the world. This is demonstrated by comparing the GDP of the Western powers as represented by the G7 countries (USA, Japan, Germany, France, UK, Italy and Canada) with the GDP of emerging powers. As recently as 1990, the combined GDP of the G7 was overwhelming in relation to that of today’s 7 emerging powers: China, India, Russia, Brazil, Indonesia, Mexico and South Korea (not necessarily constituting one political block). In 1990, the G7 countries had a combined GDP of USD 14.4 trillion and the emerging 7 had a GDP of USD 2.3, but by 2013 the tables had been turned, as the G7 had USD 32 trillion and the emerging 7 had USD 35 trillion. (Chart 11).
Chart 11. Share of global GDP G7 and Emerging 7

With the challenge of the ever increasing share of world economy belonging to the emerging countries, it becomes clear that the Western countries will not be able to profit sufficiently from world trade to service their debt loads.
For the time being the Western countries benefit from the privilege of having currencies that the rest of the world still largely trusts as reserve currencies. In essence, the USD and the euro enjoy a kind of monopoly status. This is what allows Western countries to gain access to cheap debt and fuel their economies with central bank financing (quantitative easing or “printing of money”). But the risk is that, with the deteriorating debt situation and diminishing share of the global economy, they will forfeit this privilege, perhaps even in the near future. What would follow from this is sharply more expensive financing and inflation, with hyperinflation as the eventual outcome. In this scenario – which I consider inevitable over the next 5 to 10 years – the economies of Western countries would essentially collapse.
The problem is that there is no way of averting this scenario, because the Western powers have lost their competitive advantages as economic powers. Eventually, their economies must shrink to match their resource and population bases. (I have written about this in the article referred to above). But it seems that the ruling Western elites have no intention of facing up to these realities. They will try to keep up a semblance of prosperity with ever new debt, as long as they can. The political parties of the West have been essentially converted into voting machines with one singular concern – that of winning the next elections. To do that they will continue to engage in what amounts to bribing of the electorate – creating new debt that fuels the national economy.
But there is no way to turn back this historical tide. Just as the aristocrat of the old regime eventually squandered his legacy, so will the Western powers.
About sources and the method
The input data has been figures of ‘real GDP growth’, figures of size of GDP of a given country, and the development of public debt over the years.
The sources used are:
– Eurostat – http://epp.eurostat.ec.europa.eu/portal/page/portal/eurostat/home/
– Finland’s statistical central – http://www.stat.fi/tup/suoluk/suoluk_kansantalous.html
– World Bank – http://data.worldbank.org/indicator/FS.AST.PRVT.GD.ZS
– Site – http://www.economicshelp.org/blog/6775/debt/total-us-debt-public-private/
– Site – http://www.tradingeconomics.com/russia/domestic-credit-to-private-sector-percent-of-gdp-wb-data.html
The input data has been cross-referenced to various sources and adjusted where needed.
The input data on Russia and the USA were initially denominated in USD and were therefore converted to euro according to the currency exchange rate on the last day of each year. The data on UK were originally given in euro (Eurostat). For these countries the fluctuation of currency rates yield considerable changes over the years which would be evened out if the reporting currency was the national currency of the country.
For Russia, we calculated GDP growth by using the US GDP deflator. This is because we consider it a significant flaw in the conventional method to adjust Russian GDP with a Russian ruble GDP deflator when the GDP is reported in USD. In the case of Russia, the real-GDP-net-of-debt figure is also corrected to adjust for the calculation error caused by the erroneous GDP deflator that Russian Statistics Agency (Rosstat) has used. We have discussed the persistent problem of Russia’s GDP growth having been underestimated due to use of a wrong GDP deflator in the study Awara Research on the Effects of Putin’s Tax Reforms 2000-2012 on State Tax Revenue and GDP:
We have not included Japan and China in the analysis due to the difficulties attributed to finding consistent data for all the input variables. For those countries we have come across problems of fractured data that do not capture all the relevant years; inconsistent data across the samples we looked at; and uncertainties about conversion of the input data into euros.
About Awara:
Awara is the leading foreign owned business administration services provider on the Russian market, serving international and local organizations and individual entrepreneurs. Our services comprise a wide array of advisory for strategic business development, establishment and investment, and the implementation and execution of our advice; covering all areas of:
• Accounting
• Audit
• Tax compliance
• Tax advice
• Law
Contact Details:
Awara
www.awaragroup.com
Global call center: +
Would you like to share your thoughts?
Your email address will not be published. Required fields are marked *




21 Comments