Awara Group Research on the Effects of Putin’s Tax Reforms 2000-2012 on State Tax Revenue and GDP
Awara Group Research on the Effects of Putin’s Tax Reforms 2000-2012 on State Tax Revenue and GDP
4,722 viewsThis research represents the Introduction chapter of the Awara Russian Tax Guide book:
READ IN PDF READ BY CHAPTERS
The taxation system, or rather the lack of a transparent, predictable and stable taxation system, has widely been considered as one of the main reasons for the economic woes that Russia experienced during the 1990s, after the country entered the shaky path of democracy and market economy. But after the tax reform was ushered in beginning from 2000 the taxation system went from being the big hindrance for investments and economic growth to being the locomotive of Russian economic success.
In the Soviet Union, the predecessor state to Russia, there existed in practice no real taxation system. This was quite natural against the background that the USSR, with its planned economy, was meant to be the first ever state without taxes. Practically, all property and assets were state-owned and the central planning organization collected and allocated resources at its will. In the planned economy companies were not actually taxed, they rather transferred certain residual amounts of financing back to the center.
With the downfall of the USSR and the economic reforms in Russia, a tax system started to emerge at the beginning of the 1990s. During these early years of reform the tax laws did not take shape within a unified system, but rather through a chaotic ad hoc adoption of laws and regulations. Moreover, during these early years the laws regulating taxation kept changing frequently. There was a lack of clear provisions of norm hierarchy (knowing which laws would take precedence over others) and a lack of statutory rules defining the authority of various governmental bodies. This led to serious flaws in the legal protection of the taxpayer, who was often left to the arbitrary whim of various authorities. Corruption and arbitrary practices were widespread among the officials of the tax authority.
It was only after Vladimir Putin became president in 2000 that order was brought into taxation in Russia, with the great tax reform and the gradual adoption of the Russian Tax Code Part II with lower tax rates and clearer rules concerning each of the different types of taxes. Tax Code Part I, containing the legal and administrative principles regulating taxation, was enacted in 1998. Gradually over the years, much aided by court practice and the precedents developed by the Constitutional Court and Supreme Commercial Court (“Supreme Arbitration Court”), the principles of Russian taxation and tax administration have developed to represent the best area of Russian state administration. Today the tax reform stands out as the prime example of Russia’s success during the 12 years of reforms. At the heart of the reforms lies the classical liberal tax theory, according to which lower taxes translates into increased tax revenues. Therefore, it is an interesting historic irony that Russia, a country where the socialist creed reigned strong until very recently, has now been converted into the international showcase of economic liberalism. In America Ronald Reagan and like-minded politicians were known for campaigning for such tax policies, but it is only in Putin’s Russia that they were implemented. Hardly could Reagan have even dreamt of such measures as Putin’s 13% flat income tax rate. Fair to say that never before has there been such a dramatic and speedy shift from socialist tax policies to classical liberalism, and hardly could the results have been any more impressive.
The tax reform as a model for far-sighted and well-thought out legislation also had the side-effect of helping to improve the overall lawmaking process and bring stability to state administration. This is also the area of the judiciary that is showing the most encouraging signs of development towards a system where court precedents are awarded a significant role, sometimes even resembling more the Anglo-American system than the stiffer European practices. As we predicted in the introductory chapter to the 2007 edition, courts and court practice with their precedents have had a decisive and positive role in shaping the tax laws in Russia.
The big remaining problem with the Russian tax system, notwithstanding the significant improvements during the last few years, is the heavy administrative burden, red tape and bureaucracy that the taxpayers are subjected to. But it seems that the Russian Government has finally acknowledged the problem, and therefore there are hopes that these excesses will be tackled in the future and the system streamlined.
The tax reform spearheaded by Putin has given Russia Europe’s most liberal system of taxation. Today in Russia there are in place transparent tax laws and internationally low tax rates, which provide good incentives for hard work. The corporate profit tax rate is 20 % and in taxation of personal income residents of Russia enjoy a record low 13% flat tax rate for all income brackets.
The total real tax on labor costs in Russia is among the lowest in the world. To determine what is the real tax rate on labor (payroll taxes), one must consider not only the personal income tax but also all the other statutory charges on medicine, pension and other social security benefits that are charged both from the employee and the employer (social security contributions). In Russia no social security charges are levied on the employee (the employer bearing the entire burden) whereas in most countries globally the employee is also liable for social security charges. The employer’s social contributions are charged on a regressive scale at a rate of 30% for the first 624 thousand rubles of annual salary, after which the rest is charged at a rate of 10%. (The limit was 568,000 in year 2013). In addition there is only the mandatory workplace accident insurance with rates that vary according to the activities of the firm. The rate would be 0.2% concerning the typical office worker.
Considering the low level of personal income tax, the absence of social contributions charged from the employee, and the regressive scale of the employer’s social contributions, the total payroll taxes in Russia are among the lowest in the world. This has been confirmed by a survey undertaken by Awara in connection with publishing this book Awara Global Survey of Total Payroll Taxes. The survey shows that in a global comparison the real tax in Russia on labor costs is exceptionally low. The survey measured what in various countries is the relation between the net take-home pay (net salary after taxes) and the total cost that the employer must carry considering the gross salary and all payroll taxes. Thus the survey tells how much the employer has to pay in order for the employee to receive a certain net salary after all statutory deductions. This can be expressed as the Gross Labor Cost Multiplicator, the factor by which net pay is multiplied to yield the total employer costs. (Figure 1). Conversely the same is expressed as the Net Take-Home Percentage, the percentage of the gross labor cost that the employee enjoys after tax. (Figure 2). This shows what in various countries is the actual tax burden on labor. (This is sometimes referred to as the tax wedge). It is seldom that all these three main tax elements (personal income taxes, employee’s social contributions, and employer’s social contributions) are combined in one transparent measure like the Awara survey does. Often a comparison is made only on the personal income tax rates, or the employer’s total cost without considering the employee taxes and social contributions charged from the employee.
Awara Survey on Total Global Statutory Payroll Cost:
READ IN PDF READ IN OUR BLOG
| Figure 1 – Gross Labor Cost Multiplicator | |||
| 24.000 Euro Salary | 60.000 Euro Salary | ||
| Country | Gross Labor Cost Multiplicator | Country | Gross Labor Cost Multiplicator |
| Cyprus | 1,24 | Mauritius | 1,29 |
| Mozambique | 1,26 | Chile | 1,31 |
| Mauritius | 1,29 | Russia | 1,32 |
| Luxembourg | 1,33 | Mozambique | 1,40 |
| Malta | 1,36 | Malta | 1,42 |
| Chile | 1,37 | Luxembourg | 1,47 |
| USA | 1,38 | Sudan | 1,52 |
| Russia | 1,39 | USA | 1,52 |
| Ireland | 1,45 | Cyprus | 1,54 |
| Sudan | 1,52 | Mexico | 1,57 |
| Indonesia | 1,52 | Indonesia | 1,63 |
| Mexico | 1,54 | Canada | 1,64 |
| UK | 1,55 | China | 1,64 |
| Greece | 1,55 | Ireland | 1,71 |
| Finland | 1,56 | Lithuania | 1,73 |
| Norway | 1,56 | UK | 1,75 |
| Canada | 1,64 | Estonia | 1,77 |
| Netherlands | 1,70 | Norway | 1,81 |
| Lithuania | 1,73 | Slovakia | 1,88 |
| Denmark | 1,73 | Finland | 1,91 |
| Austria | 1,73 | Greece | 1,94 |
| Estonia | 1,75 | Denmark | 1,94 |
| Germany | 1,82 | Czech Republic | 1,95 |
| Poland | 1,82 | Spain | 1,95 |
| Czech Republic | 1,84 | Hungary | 1,96 |
| Spain | 1,92 | Switzerland | 2,02 |
| Belgium | 1,93 | Poland | 2,06 |
| Switzerland | 1,96 | Germany | 2,15 |
| Portugal | 1,96 | Austria | 2,16 |
| Hungary | 1,96 | Sweden | 2,20 |
| China | 1,99 | Netherlands | 2,26 |
| Slovakia | 2,00 | Portugal | 2,30 |
| Italy | 2,03 | Italy | 2,33 |
| France | 2,04 | France | 2,44 |
| Sweden | 2,04 | Belgium | 2,51 |
| Source: Awara Global Survey of Total Payroll Taxes awarablogs.com/tax-survey | |||
| Figure 2 – Net Take-Home Percentage | |||
| 24.000 Euro Salary | 60.000 Euro Salary | ||
| Country | Net Take-Home, % | Country | Net Take-Home, % |
| Cyprus | 81% | Mauritius | 77% |
| Mozambique | 79% | Chile | 77% |
| Mauritius | 77% | Russia | 76% |
| Luxembourg | 75% | Mozambique | 71% |
| Malta | 73% | Malta | 70% |
| Chile | 73% | Luxembourg | 68% |
| USA | 73% | Sudan | 66% |
| Russia | 72% | USA | 66% |
| Ireland | 69% | Cyprus | 65% |
| Sudan | 66% | Mexico | 64% |
| Indonesia | 66% | Indonesia | 61% |
| Mexico | 65% | Canada | 61% |
| UK | 65% | China | 61% |
| Greece | 64% | Ireland | 58% |
| Finland | 64% | Lithuania | 58% |
| Norway | 64% | UK | 57% |
| Canada | 61% | Estonia | 56% |
| Netherlands | 59% | Norway | 55% |
| Lithuania | 58% | Slovakia | 53% |
| Denmark | 58% | Finland | 52% |
| Austria | 58% | Greece | 52% |
| Estonia | 57% | Denmark | 51% |
| Germany | 55% | Czech Republic | 51% |
| Poland | 55% | Spain | 51% |
| Czech Republic | 54% | Hungary | 51% |
| Spain | 52% | Switzerland | 49% |
| Belgium | 52% | Poland | 49% |
| Switzerland | 51% | Germany | 47% |
| Portugal | 51% | Austria | 46% |
| Hungary | 51% | Sweden | 46% |
| China | 50% | Netherlands | 44% |
| Slovakia | 50% | Portugal | 43% |
| Italy | 49% | Italy | 43% |
| France | 49% | France | 41% |
| Sweden | 49% | Belgium | 40% |
| Source: Awara Global Survey of Total Payroll Taxes awarablogs.com/tax-survey | |||
The survey shows that the total statutory payroll cost in Russia is among the lowest in the world. On an annual salary of 24,000 euros, the Gross Labor Cost Multiplicator in Russia is 1.39. This means that at this salary level, the employer’s total payroll cost is 1.39 times the net take-home income of the employee, or expressed from another point of view, the employee receives in hand 72% of all the money that the employer must pay for the employment. On an annual salary of 60,000 euros the Gross Labor Cost Multiplicator in Russia is 1.32, whereas the employee receives in hand 76 % of that money.
Of the bigger developed nations only USA (Illinois) placed before Russia in the survey in the salary level of 24,000 euro per year with a multiplicator of 1.38. At the same time most European Union countries showed multiplicators from 1.5 to 2. On the salary level of 60,000 euro per year the picture was even more favorable for Russia. Due to an increasing tax burden with higher salary levels, so-called tax progression, the multiplicator of USA had at the salary level of 60,000 euro deteriorated to 1.52, while the European Union countries (excluding some of the smaller ones with specific economic conditions) now ranged from UK’s 1.75 to Belgium’s 2.51. This means that in Russia an employee would from a gross salary of 5,000 euro per month receive a net salary of 4,350 euro and the total monthly cost for an employer would be 5,720 euro, whereas an employee in Belgium would be left with 2,670 euro from a salary of 5,000 euro whereas the total payroll cost for the employer would be 6,700 euro.
Many analysts may be fooled by the division of labor taxes into the various components and then only consider the employer’s social contributions in a comparison of labor costs. But in a real world what counts is what the employee gets as a take-home pay because the salary levels will adjust to reflect the economic necessity to receive a certain net salary as a take-home income so as to meet the individual consumption needs. In an economic sense, one may consider that when social contributions on salary are charged from the employee instead of the employer that the employee merely acts as an agent for the employer in carrying that tax burden. And the same is true for the personal income tax. The more so, in both cases, that the actual taxes are usually all over the world withheld by the employer from salaries due. It therefore follows that at the end of the analysis it is merely an accounting convention how to name the various components of payroll taxes, they are all equally taxes on labor.
The failure to understand the above discussed principles of total labor taxes is particularly evident in respect to the global comparison of tax systems called Paying Taxes 2014 by the World Bank, IFC and PWC1. (For reasons which remain unexplained this study which refers to data from year 2012 and was published in November 2013 is called Paying Taxes 2014).
The study forms part of the bigger project known as World Bank’s Ease of Doing Business Index. This bigger survey measures regulations affecting 11 areas of business activity, among them the regulations concerning taxation which is done in the context of the Paying Taxes survey. The tax survey attempts to measure both the compliance burden on tax administration (number of tax filings and the time it takes to perform them) and the cost of all taxes borne (the total tax rate). Unfortunately the methodology of the survey in respect to the total tax rate, and in particular concerning the total payroll taxes, is grossly inadequate as it only considers the taxes directly borne by the employer company (employer’s social security contributions) and totally ignores the payroll taxes that are relegated to be charged from the employee (personal income tax and employee’s social contributions). As a result the survey portrays a much skewed picture of the total tax burden. A case in point is Russia, which in reality as we have seen has among the lowest payroll taxes in the world, has been awarded a dismal ranking in the indicator of total tax rate. Russia is in the methodology of World Bank placed 178th out of 189 countries on this parameter. According to these misguided criteria taxes in Russia is supposed to take 50.7 of the profit placing Russia 56th in the rating.
To show how misguided an effort it is, as the World Bank does, to rank the tax burden solely by the criteria of what is the direct employer’s social contributions we may look at the global comparison tables that show what are the personal income tax rates and what is the share of the employee’s social contributions of the total labor taxes.
Figure 3 shows the rate for personal income tax in various countries according to the Awara survey. We see that Russia has the 9 lowest rate at the salary level of 24 thousand euros and 3rd lowest rate at the level of 60 thousand.
| Figure 3. Personal Income Tax Rates for 24K and 60K Income Levels | |||
| 24.000 Euro Salary | 60.000 Euro Salary | ||
| Country | Personal Income Tax | Country | Personal Income Tax |
| Luxembourg | 1% | Luxembourg | 9.14% |
| Cyprus | 3.75% | Chile | 12% |
| Chile | 3.9% | Russia | 13% |
| China | 8.23% | Lithuania | 15% |
| France | 8.35% | Sudan | 15% |
| USA | 9.30% | Mauritius | 15% |
| Germany | 11.27% | Hungary | 16% |
| Austria | 11.45% | USA | 16.7% |
| Russia | 13% | Switzerland | 20% |
| Mozambique | 14.7% | Estonia | 20.4% |
| Malta | 14.96% | China | 20.73% |
| Lithuania | 15% | Slovakia | 21% |
| Sudan | 15% | Czech Republic | 21.3% |
| Mauritius | 15% | France | 21.35% |
| Finland | 15.5% | Cyprus | 21.6% |
| Czech Republic | 16% | Mozambique | 22.8% |
| Hungary | 16% | Germany | 23.76% |
| Belgium | 17.6% | Mexico | 24.33% |
| Norway | 18% | Canada | 24.9% |
| Switzerland | 18% | Malta | 25.18% |
| Mexico | 18.72% | UK | 26% |
| Greece | 19% | Austria | 26.08% |
| Slovakia | 19% | Poland | 27.04% |
| Poland | 19.35% | Norway | 28% |
| Estonia | 19.49% | Ireland | 29.52% |
| Ireland | 20% | Finland | 30% |
| UK | 20% | Indonesia | 30% |
| Canada | 20.05% | Belgium33.46% | 33.46% |
| Netherlands | 22.30% | Greece | 33.5% |
| Indonesia | 25% | Italy | 33.9% |
| Portugal | 25.83% | Spain | 34% |
| Spain | 26% | Sweden | 34.3% |
| Sweden | 28.54% | Portugal | 35.2% |
| Italy | 28.86% | Netherlands | 36.5% |
| Denmark | 35.50% | Denmark | 42.6% |
| Source: Awara Global Survey of Total Payroll Taxes awarablogs.com/tax-survey | |||
Figure 4 shows that the share of employee’s social contributions of total social contributions is the lowest in the world as Russia does not levy such charges on employees whereas most countries in the world does it.
| Figure 4. Employee’s Social Contributions, Share of Total Social Contributions | |||
| 24.000 Euro Salary | 60.000 Euro Salary | ||
| Country | Employee’s Social Contributions, Share of Total Social Contributions | Country | Employee’s Social Contributions, Share of Total Social Contributions |
| Mauritius | 0% | Mauritius | 0% |
| Russia | 0% | Russia | 0% |
| Denmark | 0% | Denmark | 0% |
| Estonia | 11% | Estonia | 11% |
| Mexico | 12% | Mexico | 12% |
| Indonesia | 15% | Indonesia | 15% |
| Spain | 17% | Spain | 18% |
| Sweden | 18% | Sweden | 16% |
| Netherlands | 19% | Netherlands | 15% |
| Finland | 20% | Finland | 20% |
| Lithuania | 22% | Lithuania | 22% |
| Czech Republic | 24% | Czech Republic | 23% |
| Canada | 26% | Canada | 18% |
| Slovakia | 28% | Slovakia | 27% |
| Belgium | 28% | Belgium | 28% |
| Portugal | 32% | Portugal | 32% |
| Sudan | 32% | Sudan | 32% |
| Norway | 33% | Norway | 33% |
| Italy | 33% | Italy | 33% |
| Greece | 33% | Greece | 33% |
| China | 34% | China | 33% |
| France | 34% | France | 37% |
| Poland | 38% | Poland | 38% |
| Cyprus | 39% | Cyprus | 39% |
| Hungary | 39% | Hungary | 39% |
| Mozambique | 43% | Mozambique | 43% |
| UK | 45% | UK | 44% |
| Austria | 45% | Austria | 45% |
| Luxembourg | 46% | Luxembourg | 46% |
| Malta | 50% | Malta | 50% |
| USA | 50% | USA | 50% |
| Switzerland | 50% | Switzerland | 50% |
| Germany | 52% | Germany | 53% |
| Ireland | 55% | Ireland | 45% |
| Chile | 77% | Chile | 78% |
| Source: Awara Global Survey of Total Payroll Taxes awarablogs.com/tax-survey | |||
The World Bank survey contains several other flaws, not only is its theoretical framework wrong but wrong are also the actual methodology and the assumptions that the survey is based on. The point is that the World Bank with PWC has not in fact studied any real data and instead bases its survey on what would in a fictive world be the fictitious taxation of a hypothetical company. They determine certain parameters for this fictive company and then ask representatives of various countries to opine what would be the tax burden if such a company under such and such assumptions would operate in the given country. The business of this hypothetical company is defined as the production of ceramic flowerpots which it sells at retail. At the same time it is set that the company operates in the economy’s largest business city, which in the case of Russia would be Moscow, or in case of UK – London, in Sweden – Stockholm. Thus to start with the premises of the survey are totally flawed. It is a very unreasonable assumption that such kind of business would be conducted in these kinds of European metropolises. There is also an assumption that the model company would employee the same amount of management and staff in each country, namely: 4 managers, 8 assistants, and 48 workers. There then is the question of how to define the salaries of the employees. This has in the fictitious survey been resolved by determining that the managers receive an annual salary defined as ‘2.25*income per capita’, the assistants ‘1,25* income per capita,’ and workers ‘1*income per capita.’ By ‘income per capita’ the World Bank apparently refers to GDP per capita. But it is a strange assumption to determine salaries in such a way. GDP has very little, if anything, to do with salaries. It is even more strange that for this survey which refers to data of year 2012 (and is called the 2014 survey) uses the GDP data of year 2005 to determine the fictive salaries for year 2012. The GDP per capita for Russia in year 2012 was 14,037 according to the proper World Bank, but in the survey they used the 2005 figure of 5,337 USD, thus completely distorting any possibility to a real comparison.
The problem with these totally unrealistic assumptions are that in various countries the rates of taxes and total tax burden are different for different levels of income. Thus when the survey defines the salaries at a completely unrealistically low level then the tax burden is not properly expressed. It was already mentioned above that the theoretical framework of the World Bank study was wrong to start with as it, while purporting to give the “total labor tax rates,” solely included the employer’s social contribution in the calculations and excluded the employee’s social contributions and personal income tax which make up the majority of labor taxes. As Russia has low personal income taxes and no employee’s social contributions this already places Russia at a disadvantage. But then the survey introduced another flaw by the series of blatantly wrong assumptions about the salary levels. As Russia applies a regressive scale on employer’s social contributions, this resulted in the labor tax on that parameter seeming much higher than it in reality is. Using realistic salary assumptions (provided by Awara Direct Search recruitment agency), the total salary costs for the given positions would be 665 thousand US dollars, that is, more than double the salaries given for the survey, which was 304 thousand USD. This more realistic salary level in turn would yield 18.6% as the total level of labor taxes (by the flawed method of only considering the employer’s social contributions), whereas the wrong assumptions yielded 32.5%, again almost the double of what more fair calculations would have yielded.
We have not attempted to analyze how the figures of the other taxes of the survey were actually arrived at, but given these apparent flaws in the labor taxes we may assume distortions in regards to them, too. It therefore seems to me that instead of attempting such a quasi-scientific survey, the World Bank should measure the tax burden not in relation to such a model company fraught with such numbers of defects in underlying assumptions and instead calculate the tax burden as we have done it in the Awara Global Survey of Total Payroll Taxes, that is, by directly analyzing the applicable tax laws to a given level of salary.
Flat Tax leads to Surges in Tax Revenue
Russia’s liberal tax reforms have yielded precisely the results a liberal theory would predict: with lower tax rates and simplified procedures, tax intake has surged – this when at the same time the economy has grown in leaps and bounds. We will show below, with reference to several figures, how tax revenue has skyrocketed from the onset of the tax reforms in the first year of Putin’s presidency in 2000. In order to make all figures comparative and to remove distortions caused by inflation and devaluation, we present all figures in US dollars. Figure 5 shows the overall increase in state revenue from 1999 to 2012. The figures include tax revenue and all other state revenue, such as customs duties and employer’s social contributions. In 1999, the year before Putin became president and prior to the onset of the tax reform, Russia’s total state revenue was equal to 49 billion USD. In year 2012 this figure had snowballed into 743 billion. This represents an increase of more than 15 times in 13 years.
Figure 5: Total State Revenue 1999-2012
In 1999 the Russian state collected a mere 9 billion USD in corporate profit tax, but in 2012 the country raked in as much as 76 billion USD. (Figure 6).This represents an increase of more than 8 times compared to the year prior to the onset of reforms.
Figure 6: Corporate Profit Tax 1999 – 2012
The introduction of the 13% flat tax on personal income resulted in 2012 in a 15-times increase of revenue on this tax to 76 billion from the 5 billion of year 1999. (Figure 7).
Figure 7: Personal Income Tax 1999 – 2012
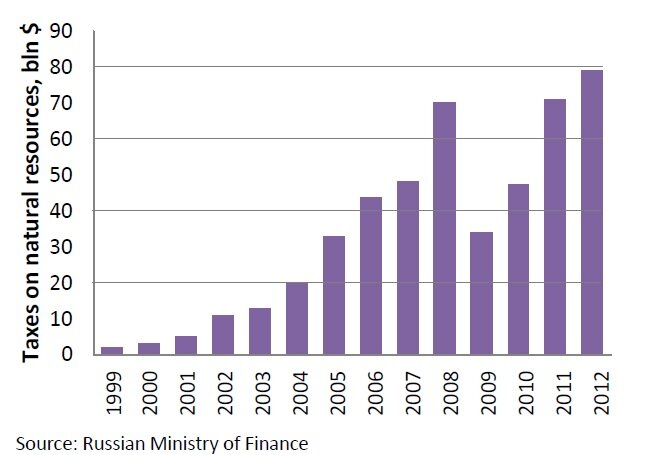
Revenue on various sorts of taxes on natural resources filled state coffers with 79 billion USD in 2012, whereas the corresponding figure for 1999 was a mere 2 billion. (Figure 8). This is also a case in point to refute the criticism that supposedly Russia’s economic miracle was a windfall, exploiting its natural resource base and not attributable to the achievements of the political leadership. Yet these critiques forget that those minerals and natural resources have been in the Russian subsoil forever and it is only under Vladimir Putin’s leadership that they have been taxed for the benefit of the economy and the Russian people. The tax reform has been pivotal in this respect.
Figure 8: Taxes on Natural Resources, 1999 – 2012
THE RUSSIAN ECONOMIC MIRACLE
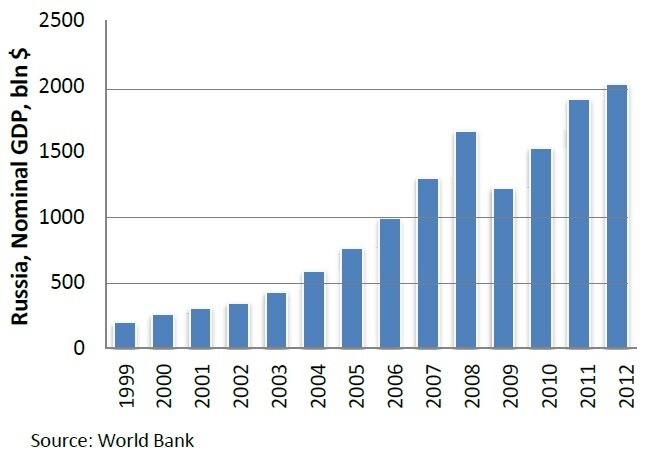
The Russian gross domestic product (GDP) in dollar terms has increased tenfold since Vladimir Putin first took office in year 2000. (All data are taken from World Bank if otherwise not stated). At end of 1999 the Russian nominal GDP was in US dollar terms 196 billion. By the end of 2012 the nominal GDP had risen to two trillions and 15 billion (2,015 billion; Figure 9). This represents a growth of more than 1000% in 12 years.
Figure 9: Russia, Nominal GDP 1999-2012
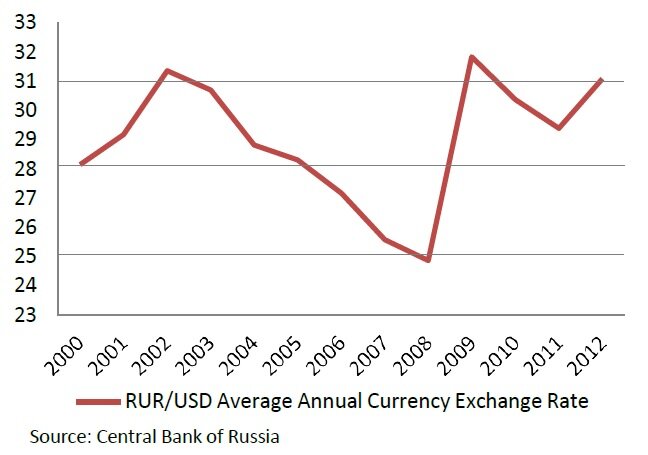
Considering the economic indicators in this article, it is important to keep in mind that the exchange rate between the Russian ruble and US dollar has been relatively stable over the years under analysis (Figure 10). The average exchange rate for the starting year 2000 was 28.14, while it was 31.08 in 2012.
Figure 10: RUR/USD Average Annual Currency Exchange Rate 2000 – 2012
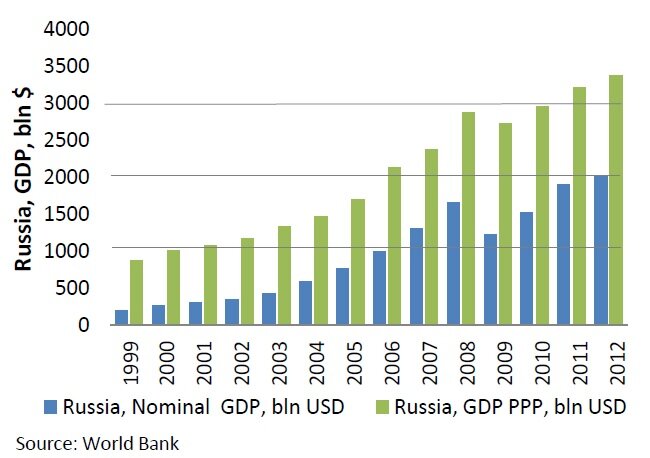
When attempting a comparison of GDP between countries, the nominal GDP figures may be misleading as they do not account for the different price levels in the countries. For this purpose economists calculate GDP estimations at PPP or purchasing power parity. If we report the figures in USD then the PPP calculations indicate what would be the size of the economy (the sum value of all goods and services produced in that country) valued at prices prevailing in the United States. This is the comparison how much one dollar buys in various countries. Expressing the GDP in PPP, the Russian economy has grown from 870 billion USD in 1999 to 3,373 in 2012. (Figure 11). By this measure Russia became in 2012 Europe’s largest economy and the 5th largest economy in the world after USA, China, India and Japan. I refer in this article to the nominal GDP as the real-real GDP (in contrast to the wrong figure that the economists term “real GDP”) but admittedly the GDP measured in PPP would probably deserve that denomination even better. The dynamics of the PPP and nominal measure are given in Figure 12.
Figure 11: Russia, GDP PPP 1999-2012
Figure 12: GDP PPP Compared with GDP Nominal 1999 -2012
There is a third way to measure GDP which is to measure it in so-called “constant prices.” This is a quite misconceived method as it attempts to remove the effects of price inflation from the nominal GDP by venturing a restatement of the GDP expressed in current year’s market prices by recalculating them in the prices of a preceding year, the base year. The idea is that by the use of a so-called GDP deflator, which matches the prices to the base year prices, one would arrive at a measure of real change in economic output free from inflation. By doing so this recalculation would yield something the economists want to call a “real GDP” which would reflect only differences in output volume from year to year. But this is quite a remarkable undertaking to start with, because the GDP, gross domestic product, is by definition the market value of all (final) goods and services produced within a country. If you remove market values from the equation, then the result is not any more GDP but something else. Therefore it is quite absurd, to put it mildly, that when the real-real GDP(which the economists want to call ‘nominal GDP’) is artificially adjusted to some supposed prices of a previous base year, the economists declare this product of fancy the “real GDP.” To start with a GDP measure is not a matter of fact of any kind, but a result of surveys, of a multitude of surveys, carried out mainly by governmental bodies for statistics continuously during the year and frequently adjusted when new input to the surveys arrive. Various assumptions, conventions and ad hoc concessions lay at the roots of the figures, which from time to time are pronounced to be the GDP. With these “constant prices” of a previous base year which are used for calculating the “real GDP” all the assumptions grow exponentially so as to finally border with the nonsensical. If there is an urge to calculate this “GDP in constant prices” then it seems to me that at least they should have the decency to refer to such a figure as the ‘adjusted GDP’ or better yet ‘virtual GDP’ and leave the good name of ‘real GDP’ to the one they presently call ‘nominal GDP’ – which is as real as they come. It is especially interesting that the economists seem to have a need to refer to this adjusted so-called real GDP when the question is about Russia’s economic performance. But we never hear that the real GDP of, for example, USA would be so and so much if expressed in constant prices of 1991 as it is done in the case of Russia.
What lies behind this is the attempt to depreciate the economic success of Russia by attempting to prove that the economy in fact has not developed as much as it has. But doing so the economists lose sight of the fact that GDP is nothing else than the measure of the market value of goods and services produced in the national economy. And in the case of Russia this market value has increased tenfold in the period we are analyzing. This cannot be denied. What then is the significance of such an increase of the market value measured as GDP is another question, but in no way particular to Russia. Depreciating the Russian GDP, one should depreciate the whole notion of GDP in reference to all countries. If the “real GDP” of Russia is something else than what our lying eyes tell us, then the GDP measures of other countries are not either what they would seem to be.
The actual GDP measure (the real-real GDP) multiplies the amount of goods (or services) produced by their market values (prices) in the present period. But the so-called “real GDP” transfers the measure into an index for quantity of output. This can be illustrated by the following example. If in a hypothetical economy there would, in year 1, be only 10 items of something produced for the price of 1 dollar each, then the GDP of that country would be 10 USD. Then let’s consider a situation that in year 2 two of the items would change by way of quality improvement and enhanced features and the price of these two items would increase to 2 USD each. In this case the real-real GDP (nominal GDP) would be 12 USD (8*1+2*2), but in the fancy-real GDP the reality would be adjusted so as to disregard the change in value and we would then arrive at the conclusion that the GDP was still only 10 USD as the volume of output remained 10. However, if in that year the output of the old items had increased by one to 11, then it would be recognized that the fancy-real GDP had increased to 11.
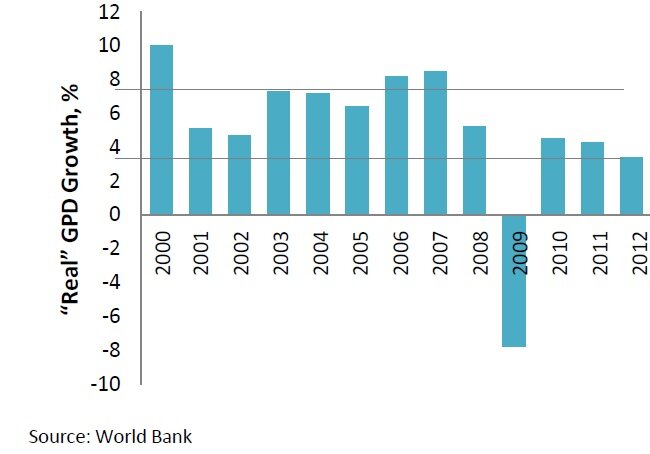
This little excursion into theory was needed so as to understand why most economists disregard the notion that Russia’s GDP has increased tenfold or 1000% during the years Putin has been at the helm, insisting that the “real GDP” has increased only 92 % (the compounded growth by the so-called “real GDP” measure) over this period, although we saw from above that it has increased more than 1000%. The economists arrive at this flawed figure by summing up the annual GDP growth figures that are given as the “real GDP”, that is, the figure which largely ignores merely and quite inadequately change in quality and only considers the volume of output. (In theory the aim is to consider change in quality but it is done with gross inadequacy, which is the real object of criticism here.) Figure 13 gives the value for these annual growth figures for “real GDP.” These yield an average annual growth rate per year of 5.2% for the period from 1999 to 2012 and a compounded growth rate of 92%.
Figure 13: Annual so-called “Real” GPD Growth 2000 – 2012
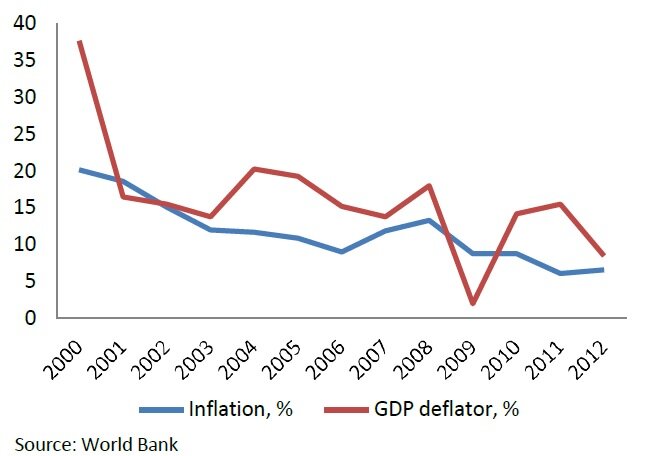
The nominal GDP divided by the “real GDP” yields a so-called GDP deflator. The GDP deflator is an attempt to measure inflation across the whole economy, as opposed to the consumer price index (CPI) which measures change of price of a typical consumer’s basket of goods and services. Figure 14 compares the CPI inflation with inflation according to the GDP deflator.
Figure 14: Inflation (CPI) and GDP Deflator 2000 – 2012
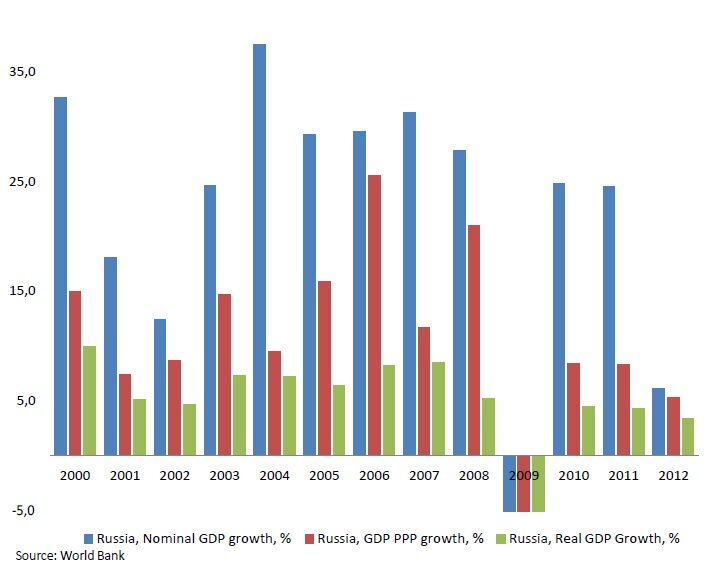
Figure 15 gives an interesting comparison of the annual GDP figures by reference to the various methods of expressing GDP: the so-called “real GDP” (which I have referred to as the ‘fancy- real GDP’); the nominal GDP (which is the actual real GDP and which I will refer to as ‘real-real GDP’); and the GDP PPP (purchasing power parity). This serves to prove how wrong the “real GDP” measure is.
Figure 15: Russia, GDP Growth: Nominal, PPP, “Real” 2000 – 2012
It is easy to understand how wrong you can get it if, in a country like Russia for 12 years, you only consider the change in output and disregard change in quality (wrongly assuming it is only monetary inflation). Russia has from 2000 up till now changed its economic structure dramatically from a post-Soviet command economy to a modern market and consumer economy. During this period the choice of products (goods) on sale have changed in quality and features so that nearly all analogues from the end of 1990’s have been eliminated from the market and investments in fixed assets have changed the production methods, whereas a whole new service culture has emerged. But according to the “real GDP” method all these changes are to be disregarded. It is as if these statistics would not recognize the value of an Armani suit over an old Soviet Bolshevichka suit, with the method of adjusting for price change they are worth equal, they are both just suits. In reality the quality and features of goods and services are in a constant change in a way that is not perceivable, and, in an emerging market like Russia, the changes are even faster and unfathomable. The method of constant prices cannot possibly account for that.
Considering these ideas, it is good to bear in mind that Russia’s inflation has been quite high for these years as evidenced by Figure 14 (above). It is therefore understandable that one would attempt to clean the effect of inflation in the traditional sense it is understood as “bubbling of prices”, or the inflation thought of as solely occurring as a result of excessive printing of money (growth of money supply) or devaluation of the currency (for example due to economic hardship). But, while trying to eliminate that effect from the statistics, the economists have really committed the error of throwing out the baby with the bathwater because these types of causes are clearly not the sole causes for inflation. Inflation (a rise in the general level of prices) is also attributable to a change in value of goods due to improved quality or new features. The German Central Bank has published a research paper that clearly analyzes the factors that affect inflation and the difficulties in properly recording it (Discussion paper 1/98 Economic Research Group of the Deutsche Bundesbank2).
The report identified four major sources of bias in the GDP deflator:
- bias resulting from the use of a “wrong” index formula (product substitution bias)
- bias due to inappropriate quality adjustment of prices (quality change bias)
- bias resulting from delayed consideration of new products (new product bias)
- bias due to insufficient consideration of changes in the retail structure (outlet substitution bias).
The authors of that report conclude that the “potential errors of measurement taken together, the evidence for Germany is that the true rate of inflation is overstated by the officially recorded increase in the Consumer Price Index. In this respect, the outcome is identical to that of studies for other countries.” According to the authors, a large number of US studies have shown in detail that traditional methods of measuring inflation can lead to a considerable overstatement of the upward trend in prices. The report cautions that “only qualified use can be made of the rates of inflation published by the statistical offices for drawing economic policy conclusions.” We learn that even in such a mature market as Germany “prices are not correctly adjusted for quality improvements.”
Naturally there is also some attempt to account for these calculation biases concerning the Russian “real GDP” figures, but they remain largely failed. Interestingly, we may compare this failed “real GDP” indicator with the figure for industrial growth. The “real GDP” growth figures for the years 2000 to 2012 compound to 92%, considering the effect of yield on yield. For the same period the compounded figures for annual industrial output accumulate to 72% (source: Rosstat). Thus, these figures closely monitor each other, which goes to show that the “real GDP” is actually only a measure of industrial output.
As a conclusion of this discussion, I would want to point out that I think that the attempt to adjust the GDP measure for inflation is a worthwhile endeavor for trying to identify the value added growth from one year to another (although in this case the adjustments certainly must be done more accurately). But it is certainly not acceptable to compound the thus adjusted annual growth figures to yield the growth over a period of years. The inflation rate and other inferences that go into it are too often based on vague assumptions. We need to bear in mind that the nominal GDP in itself is not a matter of fact but a figure arrived at through a series of surveys. Not to mention the problems with drawing the GDP figure, based on purchasing power parity (PPP), which is based on yet more assumptions and conventions. The only real way to calculate the GDP growth over a number of years is to compare the opening figure (the GDP of the first year of the comparison period) with the closing figure (the GDP of the last year of the comparison). Especially if we compare those figures in the equivalent of a freely convertible currency like the USD, then this is the closest we can come to something that can be called a fact in these matters. Then one might want to attempt to adjust this GDP expressed in USD to the USA price inflation in an endeavor to identify the “real GDP” growth. One would then use the GDP deflator for calculating USA GDP to adjust the Russian GDP. For a comparison the compounded inflation (CPI) in USA has been 37.9% for years 2000 through 2012 (GDP deflator in line with that for 2000 is 82.60). This US inflation rate compares with the more than 1000% growth of Russian GDP in USD terms showing that the Russia GDP growth is real and not inflated. Nothing can be more real than comparing the dollar denominated GDP of Russia of 1999 with its dollar denominated GDP for 2012. And that self-evident truth shows that the GDP in Russia has over these twelve years of Putin grown tenfold.
In addition to the difficulties to properly account for inflation, I would think that in the case of Russia another major difficulty has been the proper assessment of the shadow economy and especially the movement from the shadow economy into the transparent economy.
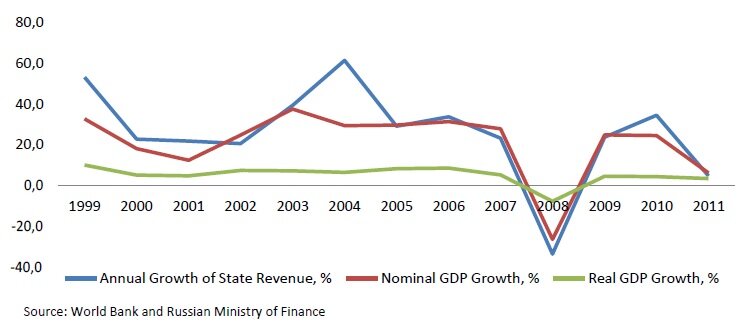
The economists’ confusion with the GDP measures become the more absurd when you consider that at least most of them do not actually reject the fact that the nominal GDP in 1999 was 196 billion USD and that it was 2,015 billion USD in 2012. They just dispute the fact that what was 196 billion and became 2,015 billion has not grown more than 10 times; they merely claim, in reference to their alchemical formulae for calculating “real GDP”, that the growth is chimeric. But if the GDP in reality has not grown to what it is – if the present real-real GDP is but a chimera – then from whence comes all the tax revenue reported above? If Russia’s tenfold GDP growth is not real, then where do we get the 10 to 15 times increase in tax and other state revenue? (Reference is made to Figures 5 to 8, above). After all the tax revenue is for real, they are real rubles collected, with the real convertible exchange rate that yield a 15 times increase in revenue. If the “real GDP” had grown only 92%, then naturally the growth in state revenue should have been on the same level and then Russia would not have had 743 billion USD in revenue in 2012, but only some 100 billion as would correspond to the “real GDP” growth. (Reference is made to Figure 16).
Figure 16: Comparison of GDP Figures with State Revenues for years 2000 – 2012
Interestingly, the chart shows that this fancy-real GDP growth is significantly lower than the growth of state revenue for this same period.
We may conclude that it is time to admit the fact that the Russian economy has since 1999 in fact grown tenfold in real terms measured by GDP. If you cannot explain that in terms of real GDP, then you might as well call it a miracle.
FROM RAGS TO RICHES
When Vladimir Putin ascended to the presidency of Russia in 2000, the country was on the brink of ruin – for many it seemed that the fall was inevitable and final. GDP per capita was at the level of traditional low-income third world nations, a mere 1/25th of the level of that of the United States. The external debt was 178 billion USD, almost equal to 100% of the country’s GDP. (External debt defined as: the total public and private debt owed to nonresidents repayable in internationally accepted currencies; source CIA World Factbook). By contrast, by the end of 2012 the external debt had dropped to a level equaling 31% of the GDP, being 632 billion USD of a now 10 times greater national economy. Note that this figure includes also the debt of business entities, private and public. For comparison, the external debt of USA at the same date was 15.93 trillion (and over 17 trillion dollars at the present date, October 2013) or 25 times higher than that of Russia, while, for example, that of France is 5.17 trillion, or 8 times higher than that of Russia’s.
Before Putin assumed the presidency, Russia had only recently gone through a devastating devaluation and received an emergency aid loan of 10 billion from the International Monetary Fund to replenish its depleted gold and foreign currency reserves. But today Russia holds the world’s fourth largest foreign-exchange and gold reserves worth 509 bln USD (August 2013, source: IMF).
At that time Russia’s government was heavily mired in its public debt; in 1999 this equaled a staggering 99% of the GDP. (Public debt records the cumulative total of all government borrowings less repayments that are denominated in a country’s home currency; source: CIA World Factbook). Today the Russian state may by international comparison be regarded as virtually debtless; the debt level has sunk to less than 10% of the GDP, while most of the developed Western nations, following a decade long debt binge, saw their public debt skyrocket to perilous levels, Japan leading the debt revelers with an astronomical 214% of debt to GDP, USA standing at 72.5%, Germany, France, the UK and Italy ranging from 80 – 127%. (Figure 17).
Figure 17: Public Debt of G20 Countries, % of GDP, 2012
The officially calculated average monthly salary in Russia was 81 USD when Putin was placed at the helm of a country plagued by anarchy, but today it equals 30 thousand rubles or approximately 1,000 USD (Rosstat, May 30, 2013). Still this average salary, in nominal terms, should not serve as a comparison with levels of affluence with Western countries in view of the much more favorable purchasing power parity in Russia and low levels of income taxation.
In 1999 12.6% of the workforce in Russia was unemployed, today the unemployment level has dwindled to 5.2% (Rosstat, August 2013), which many economists term as virtual full employment.
The World Bank estimated that in 2001 27.3% of Russians or 40 million people lived below the poverty line; by the end of 2012 this figure had dropped to 11.2%.
Russia seemed also to have overcome the worst of the demographic crisis as the birth rate had risen from 8.27 (births per 1000 people) in 2000 to 13.3% in 2012 (Rosstat), which together with brisk immigration and significantly reduced emigration has stemmed the feared plummeting of the population. The population has against predictions been reduced by less than four million from 147 million in 1999 to today’s 143.5 million (August 2013). At the same time life expectancy has normalized from the lows of 66 years in 1999 to today’s 70 years.
The overall normalization of Russia is perhaps best evidenced by the dramatically improved conditions of security of its residents, as seen against the murder statistics. In 2002, still in the aftermath of the anarchy of the 90’s, there were 44,252 murders, or 30.2 murders per 100 thousand residents. By 2011, the number of murders had dramatically fallen to 16.4 thousand murders, or 11.5 per 100 thousand. In 2012 there was a further decline to 15,408 or 10.4 per 100 thousand (source Rosstat). The figures are now at the level of the global average and far below the levels seen in the most problematic countries. Here are the statistics for some other countries: Colombia 61.1 per 100 thousand; South Africa 39.5; Brazil 30.8; Mexico 11; USA 5.6; UK 2.6; global average 9.61 (figures for 2004-2006)3. Here it needs to be kept in mind that in Russia there are big differences between its European territories, where the murder statistics are already well below the global average (and comparable to the US), and the more problematic Caucasian regions.
As this article summarizes, the economic achievements since 2000 when Putin first became president of Russia, it is appropriate to make reference to a remarkable document that set the course for Russia’s economic transformation, and indeed the tax reform. This is a prophetic article titled “Russia at the turn of the millennium” originally published on the government web and republished in print. It was a program article by the then Prime Minister Vladimir Putin, published on December 30, 1999, a day before Boris Yeltsin resigned, and thus transferred the presidency to Vladimir Putin who under the Constitution as the then prime minister became acting president. This was in essence Putin’s manifesto on how to tackle Russia’s dire woes prevailing at the time and a vision of how to lead Russia into a better future. This is a stunning document about a vision come true. The article was written in another world and in a completely different reality but yet it remains fresh, as if it had been written only recently. Based on my observations, I think that the author would not have written it much differently, even having access to all the experience gained twelve years later – he has been able to address and remedy the problems identified back then, and he has converted Russia into a country that has metamorphosed into a modern country that is now in the vanguard of the new millennium, just as he would have wished it.
The article touched all aspects of life and society, identified the problems and outlined the remedies. In essence it spelled out the strategy for Russia, the strategy that this man as the CEO of Russia meticulously implemented. For those that are interested in how one brings vision into action at the highest level of organization, at the level of an entire country, which in this case is the largest country in the world by territory and ninth largest by population, I recommend reading this article. The article can be accessed in English and Russian at the links indicated in this footnote4.
In this connection, being the introduction to a book on Russian taxation, I will only refer to Putin’s now prophetically sounding pronouncement of how many years of zealous work of a consolidated society it would take for Russia to catch up in economic terms with the Western nations. In reference to expert calculations (presumably from the Center of Strategic Research), Putin predicted that it would take 15 years to catch up with the then per capita GDP income of Portugal and Spain. This, he said, would be achieved if the Russian economy grew on average 8% annually. But he added that if the growth was at the level of 10% p.a. then Russia would reach the level of the per capita GDP prevailing in the UK or France in 1999.
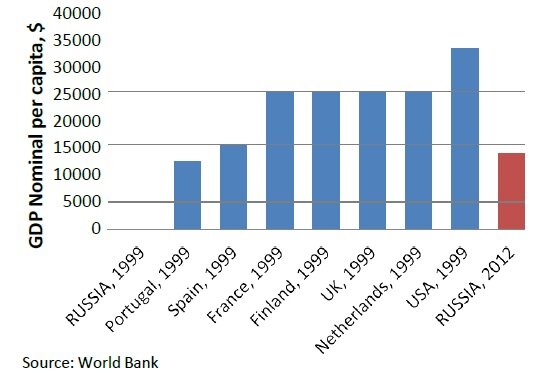
These were quite ambitious goals considering that Russia’s nominal per capita GDP for 1999 was in dollar terms 1,334. (Figure 18). The corresponding figures for the countries in comparison were: Portugal 12,473, Spain 15,473, UK 25,630, France 24,930. We can see that by this measure Russia was 9 times behind Portugal and almost 20 times behind the UK. Thirteen years later, at the end of 2012, Russia’s GDP was 14,037. Thus, in thirteen years, two years ahead of the 15 years period allowed for in the prognosis, Russia had reached the level of Portugal and Spain and made significant headway on reaching the then prevailing levels of the UK and France.
Figure 18: Putin’s Millennium challenge – GDP Nominal per Capita of Russia 1999 and 2012 Compared with Reference Countries’ GDP 1999
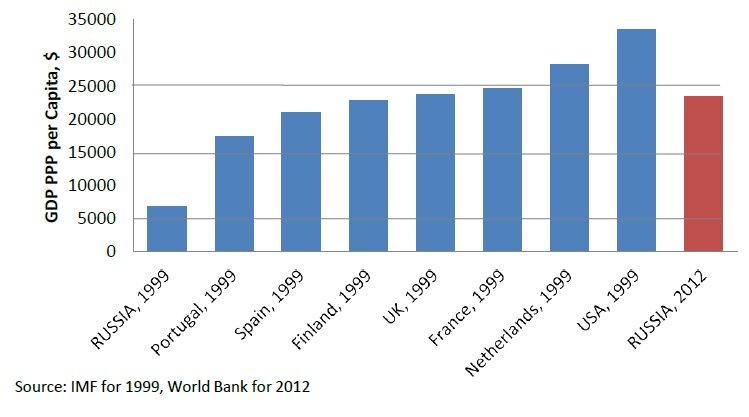
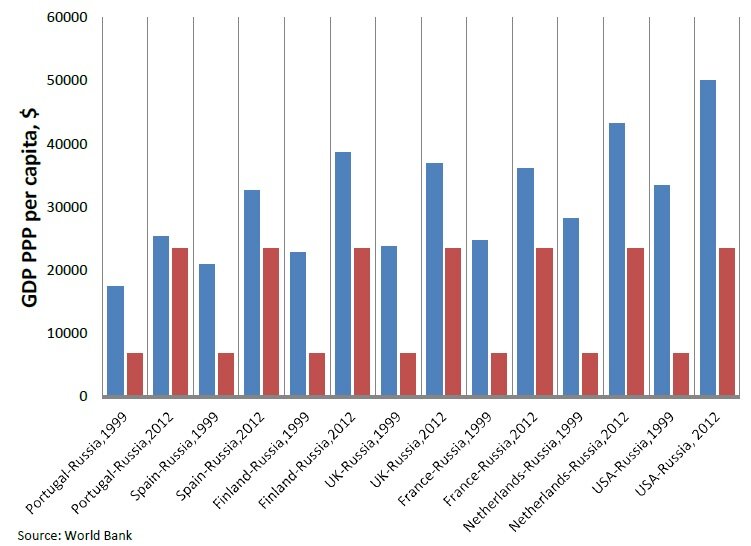
By a more accurate measure, the GDP PPP, the picture looks even rosier. In 1999 the GDP PPP per capita for Russia was 6,787 USD, while those in the comparison were: Portugal – 17,393, Spain – 21,009, UK – 23,784, France – 24,731. (Figure 19). By 2012 Russia had reached 23,501 per capita GDP measured in PPP. Thus Putin had complied with even the most ambitious goal to catch up with the GDP levels that prevailed in 1999 in the leading Western nations.
Figure 19: Putin’s Millennium challenge – GDP PPP per Capita of Russia 1999 and 2012 compared with reference countries’ GDP 1999
MIND THE GAP!
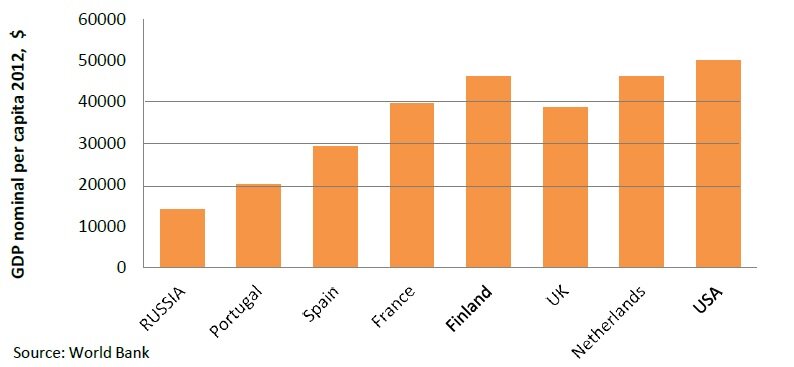
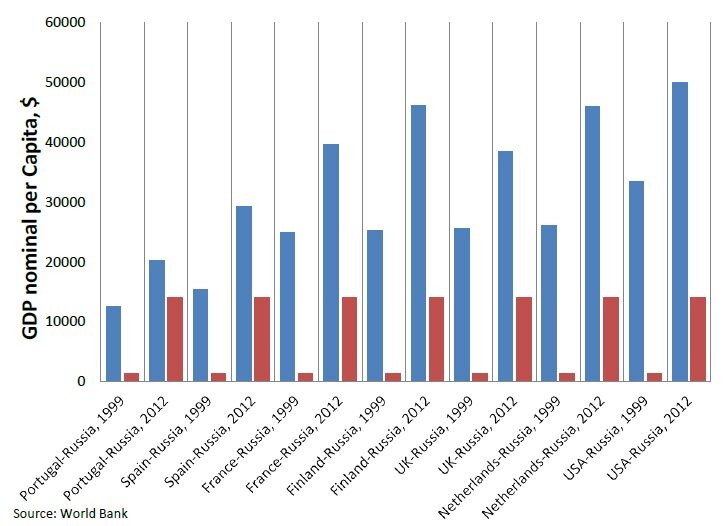
Obviously the compared countries have also grown over the years and therefore it is also interesting to study the contemporary indicators. At the end of 2012, the nominal GDP per capita for Portugal was 20,182, Spain – 29,195, UK – 38,514, France – 39,722; this when the figure for Russia was 14,037. (Figure 20). This means that the GDP gap which used to be 9 times in favor of Portugal over Russia had been reduced to only one half, while the GDP gap with the UK had narrowed so that Russia’s GDP now was one-third of UK’s, having been 1/20th. (Figure 21)
Figure 20: Putin’s Millennium challenge – GDP Nominal per Capita 2012, Russia Compared with Reference Countries
Figure 21: Putin’s Millennium Challenge – Reduction of Russia’s GDP Gap, Nominal, with Reference Countries, 2012
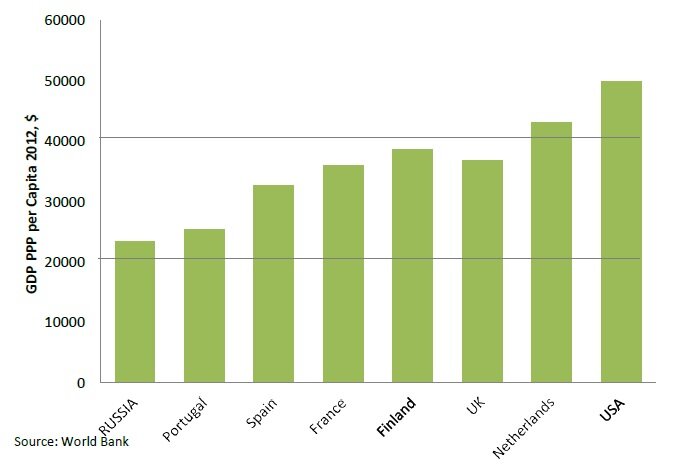
The corresponding figures of GDP per capita in PPP for 2012 are: Russia – 23,501, Portugal – 25,411, Spain – 32,682, UK – 36, 901, France – 35, 295. (Figure 22). Here we see that not only had Russia caught up with the level of Portugal of 1999, but virtually put itself on par with the present day level. The GDP gap with the other countries had also been significantly cut, Russia’s per capita income now standing at less than half of the level of the UK, while the gap in 1999 had measured 3.5 times (Figure 23); this after 13 years, with two more years still to go of the 15-year forecast period.
Figure 22: Putin’s Millennium Challenge – GDP PPP per Capita 2012, Russia Compared with Reference Countries
Figure 23: Putin’s Millennium Challenge – Decrease of Russia’s GDP Gap, PPP
It is also interesting to note how the GDP gap between the USA and Russia has been bridged during these years. The Russian GDP per capita, which still in 1999 was a mere one-twenty-fifth of the US level at end of 2012 had been reduced to between a third to a quarter. According to the purchasing power parity figure, a fifth of the US level, while at end of 2012, it had been reduced to half.
At the same time Russia has from lowly levels gone on to become the fifth largest economy in the world in just thirteen years (PPP measure, source: World Bank).
Making these comparisons, one also needs to keep in mind that Russia has reached these levels without the effect of debt doping, while the countries of the comparison have been excessively leveraged by debt during the same period. Essentially, all the growth there has been in the countries of comparison has come exclusively from debt which has been used for consumption in an attempt by the politicians in power to buy the favors of the electorates of their respective countries.
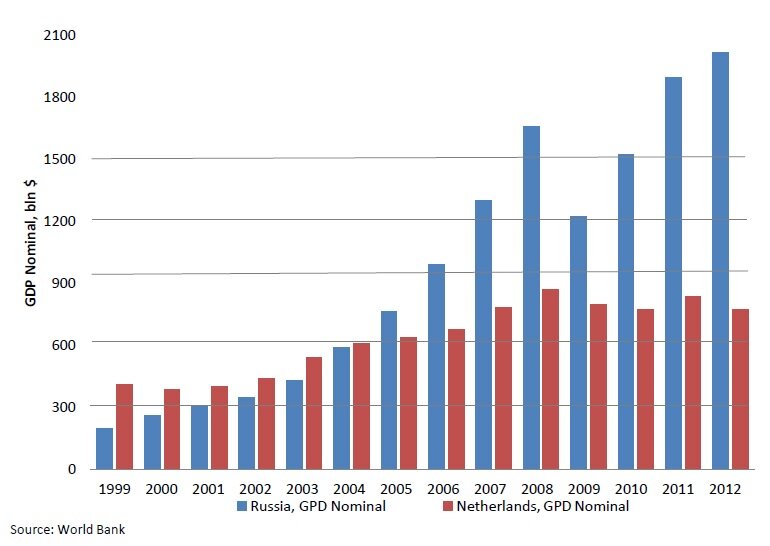
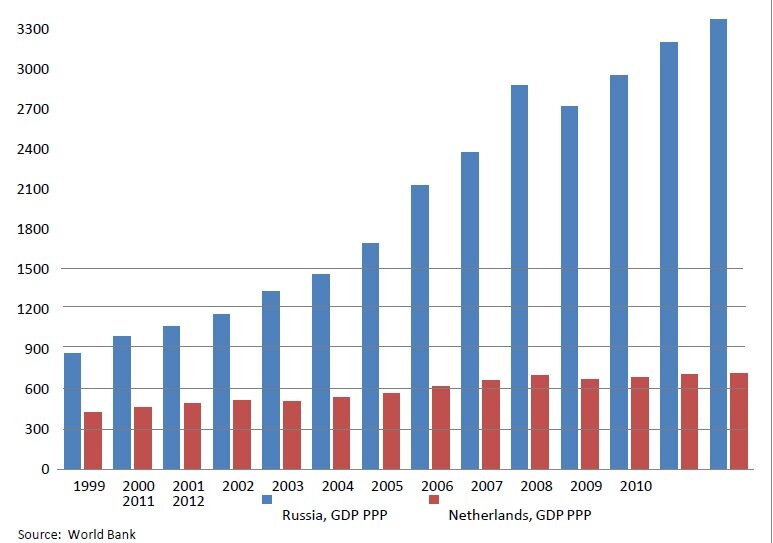
Finally, I want to address the comparison of the size of Russia’s economy with that of the Netherlands. It used to be popular, in an attempt to belittle Russia, to compare the size of its economy to that of the Dutch economy (and some critics are still singing the same tune). Back in the early years of the new millennium there was some merit to the comparison, as the size of the GDP of the two countries were comparable. In 1999, by the measure of nominal GDP, Russia’s economy at 196 billion was roughly half of that of the economy of the Netherlands which stood at 411 billion. For the same year the PPP measured GDP depicted Russia’s economy with 879 billion, twice as big as the Dutch economy at 426. But by year 2012 Russia had, by the nominal GDP, turned the tables on the Dutch economy, being measured respectively at 2,015 and 772 billion (Figure 24). The same year, according to the GDP PPP measure the Russian economy was valued at 3,370, or some 4 times bigger than the Dutch GDP at 725 (Figure 25).
Figure 24: GDP Nominal, Russia and Netherlands 1999 and 2012
Figure 25: GDP PPP, Russia and Netherlands 1991 and 2012
AWARA RUSSIAN TAX GUIDE:
For inquiries about buy Awara Russian Tax Guide, please, contact:
READ IN PDF READ BY CHAPTERS
About Awara:
Awara Group is the leading foreign owned business administration services provider on the Russian market, serving international and local organizations and individual entrepreneurs. Our services comprise a wide array of advisory for strategic business development, establishment and investment, and the implementation and execution of our advice; covering all areas of:
- Accounting
- Audit
- Tax Compliance
- Tax Advice
- Law
Contact Details:
Awara
www.awaragroup.com
Global call center: +
- http://www.doingbusiness.org/reports/thematic-reports/paying-taxes/
- www.bundesbank.de/Redaktion/EN/Downloads/Publications/Discussion_Paper_1/1998/1998_02_01_dkp_01.pdf?%20blob=publicationFile
- Jon Hellevig, Putin’s New Russia, 2012
- An English translation cited per the Appendix of Richard Sakwa’s “Putin: Russia’s choice”; in electronic form a translation can be accessed from this link http://pages.uoregon.edu/kimball/Putin.htm
Would you like to share your thoughts?
Your email address will not be published. Required fields are marked *




0 Comments